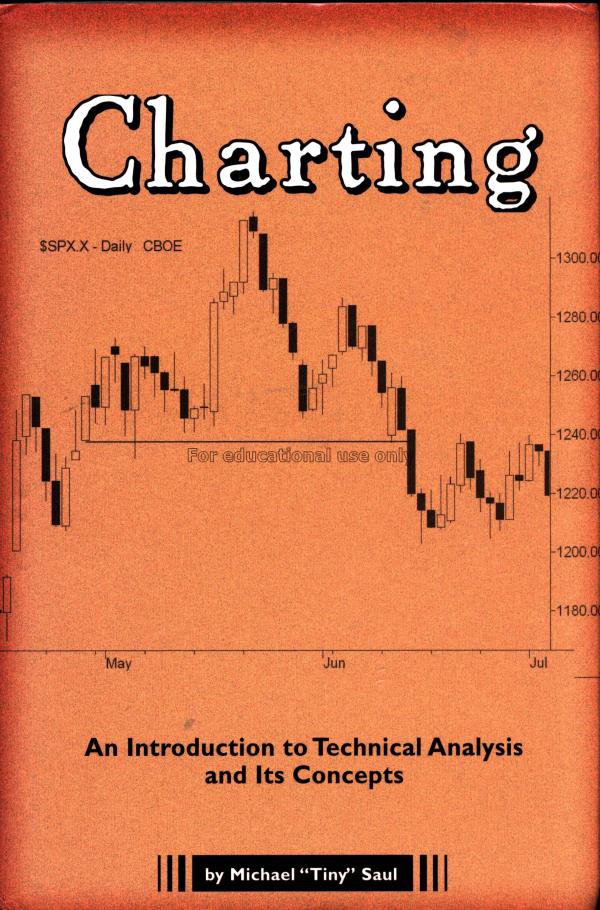
Charting : an introduction to technical analysis and its concepts / Michael "Tiny" Saul
Author : Saul, Michael

Charting is a prctical guide to charts and technical analysis. It contains a wealth of information about charts and trading stocks that you can readily adapt to your own situation. This book discusses many strategies that are applicable to daytrading, swing trading, and to intermediate or long term investing as well. The reader will gain valuable insights into technical analysis and using charts. There is a brief history of technical analysis and general chart descriptions, also with fully illustrate examples that include specific trading suggestion. This book presents technical analysis, price charts, ranges andtrends -- trendlines, log and linear scales, accelerating trendlines, swing lengths, trading trends and ranges -- Support and resistance -- Volume spikes and momentum and impulse -- Chart Pattern -- Gaps (laps, gap down, gap up, breakaway, continuation and climax gaps) --Technical indicaors (description of technical indicatore and using of its) -- Fibonacci analysis -- Inside, outside and narrow range bars -- and analysis trades
| Barcode | Call No. | Volume | Status | Due Date | Total Queue | |
|---|---|---|---|---|---|---|
| 1010036797 | IK00037 | Available | 0 | Please Login | ||
| 1010071809 | IK00037 | Available | 0 | Please Login | ||
| 1010082547 | IK00037 | On Closed Stack | 0 | Please Login |
Related Book