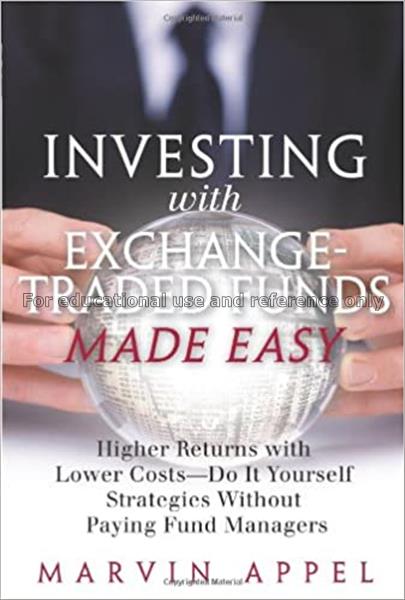
Investing with exchange traded funds made easy : higher returns with lower costs-- do it yourself strategies without paying fund managers / Marvin Appel
Author : Appel, Marvin

It is easy to obtain past return data, but hard to find risk data. A visual method of estimating investment risk using free information available on the web. Appendix 4A: where to find quantitative information about the investment risk of mutual funds and ETF?s Appendix 4B: Calculation of maximum drawdown using a spreadsheet. Appendix 4C: Calculation of standard deviation of past returns (a second measure of risk) by hand or using a spreadsheet. Chapter 5: Risk-adjusted performance (submitted on April 12, 2006)?The best measure of the success of an investment is the balance between reward and risk that it achieved. This chapter describes in detail two quantitative measures of risk-adjusted performance: the GPA / drawdown ratio and the Sharpe ratio. Appendix 5A: Calculation of compounded annual rate of return. Appendix 5B: How to calculate the Sharpe ratio using information available on the web and a spreadsheet program. Chapter 6: Diversification?the only free lunch on Wall Street Diversification helps reduce risk, especially if bond and stock investments are combined in one portfolio. This has especially been true since 1998 in the U.S. market. Chapter 7: The one-decision portfolio ?A portfolio including short term bonds, long term bonds, large stock index funds, small cap value funds and real estate investment trusts has a superior history of small losses and good long term gains. Description of the portfolio and how its performance compares to its components in terms of risk versus reward. How the reader can implement this historically effective investment program with ETF?s Chapter 8?Active strategy #1: Allocating to large or small company stocks. How small company stocks have been different from large company stocks, and why
| Barcode | Call No. | Volume | Status | Due Date | Total Queue | |
|---|---|---|---|---|---|---|
| 1010069224 | IK00017 | Available | 0 | Please Login |
Related Book