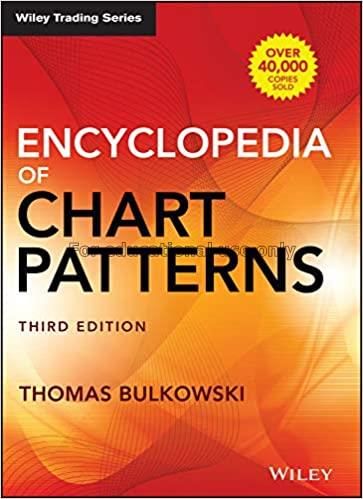
Encyclopedia of Chart Patterns / Thomas N.Bulkowsky
Author : Bulkowsky, Thomas N

The technical analyst believes that prices (stocks, mutual funds, commodities, etc.) tend to move in trends. In addition to utilizing various indicators that help identify these trends, there exist a multitude of chart patterns that will tell the analyst whether the stock or commodity is in a bullish or bearish mode. Various patterns presage certain events. These patterns tell the analyst what the stock is going to do based on where its price has been. Tracking and identifying chart patterns is an important part of the technical analyst's toolkit. Without the basic knowledge of chart formations, what they mean, why they exist, how they are used, and how to interpret them, the investor cannot determine his or her trading strategy. The broadened and revised Encyclopedia of Chart Patterns, Third Edition again offers investors the most comprehensive, up-to-date guide to this popular method of market analysis
| Barcode | Call No. | Volume | Status | Due Date | Total Queue | |
|---|---|---|---|---|---|---|
| 1040012278 | IK00262 | CheckOut | Apr 16, 2025 | 0 | Please Login |
Related Book